
Seasonal Trends
by Danny Summers

As Group Centers report their numbers each week through the WDR, Tim Quebedeaux compiles the weekly summaries that give us a clear view of where each Center, each Region, and The Group as a whole stand—both for the week and year-to-date. Every week, we dig into the numbers looking for new trends, patterns, and insights that can help us better understand what's happening in our businesses.
One area I pay particular attention to is a group of categories I call our Standard Greengoods Group. I started tracking these categories years ago and, while there are certainly a few inconsistencies, they provide a valuable way to identify long-term seasonal patterns and shifts in consumer buying behavior.
One of the key points Tim emphasizes each year in our Profit & Loss Study is the importance of maintaining a healthy balance between Perishables and Non-Perishables, noting that some of the most profitable categories in garden retailing are perishables. Simply put, the more plants you sell, the stronger your bottom line tends to be.
The categories included in my Standard Greengoods Group are:
- Annuals & Outdoor Tropicals
- Container Gardens
- Herbs & Vegetables
- Perennials
- Shrubs and
- Trees
That's six categories in total.
Tim has often suggested that I should have originally included Tropical Plants in this group. Looking back, I agree. However, reworking years of historical data would be difficult and would likely create more challenges than benefits. In addition, beginning in 2025, we shifted part of Tropicals (Outdoor Tropicals) into the Annuals category because in many regions they are sold as annuals for outdoor use.
Last week, I looked at the Standard Greenwood’s for the most recent week (Week 22) and compared them to the same week in 2025, 2024, 2023, 2022, 2021, and 2020. I am listing the percent of Sales for these Standard Greengoods Group of total sales for the week. At the same time, I reviewed each year's year-to-date performance for:
- Standard Greengoods Group % Sales
- Total Sales % +/-
- Average Sale % +/-
- Transaction Count percentages YTD % +/-
The following charts highlight those comparisons with a sales graph for the years 2023 through 2026.
In reading the graphs, the bars represent the previous year, while the line represents the current year. When the line is above the bars, sales are running ahead of the previous year. When the line falls below the bars, sales are trailing the prior year's week.
Let's begin with 2026 and work our way backward through the data.
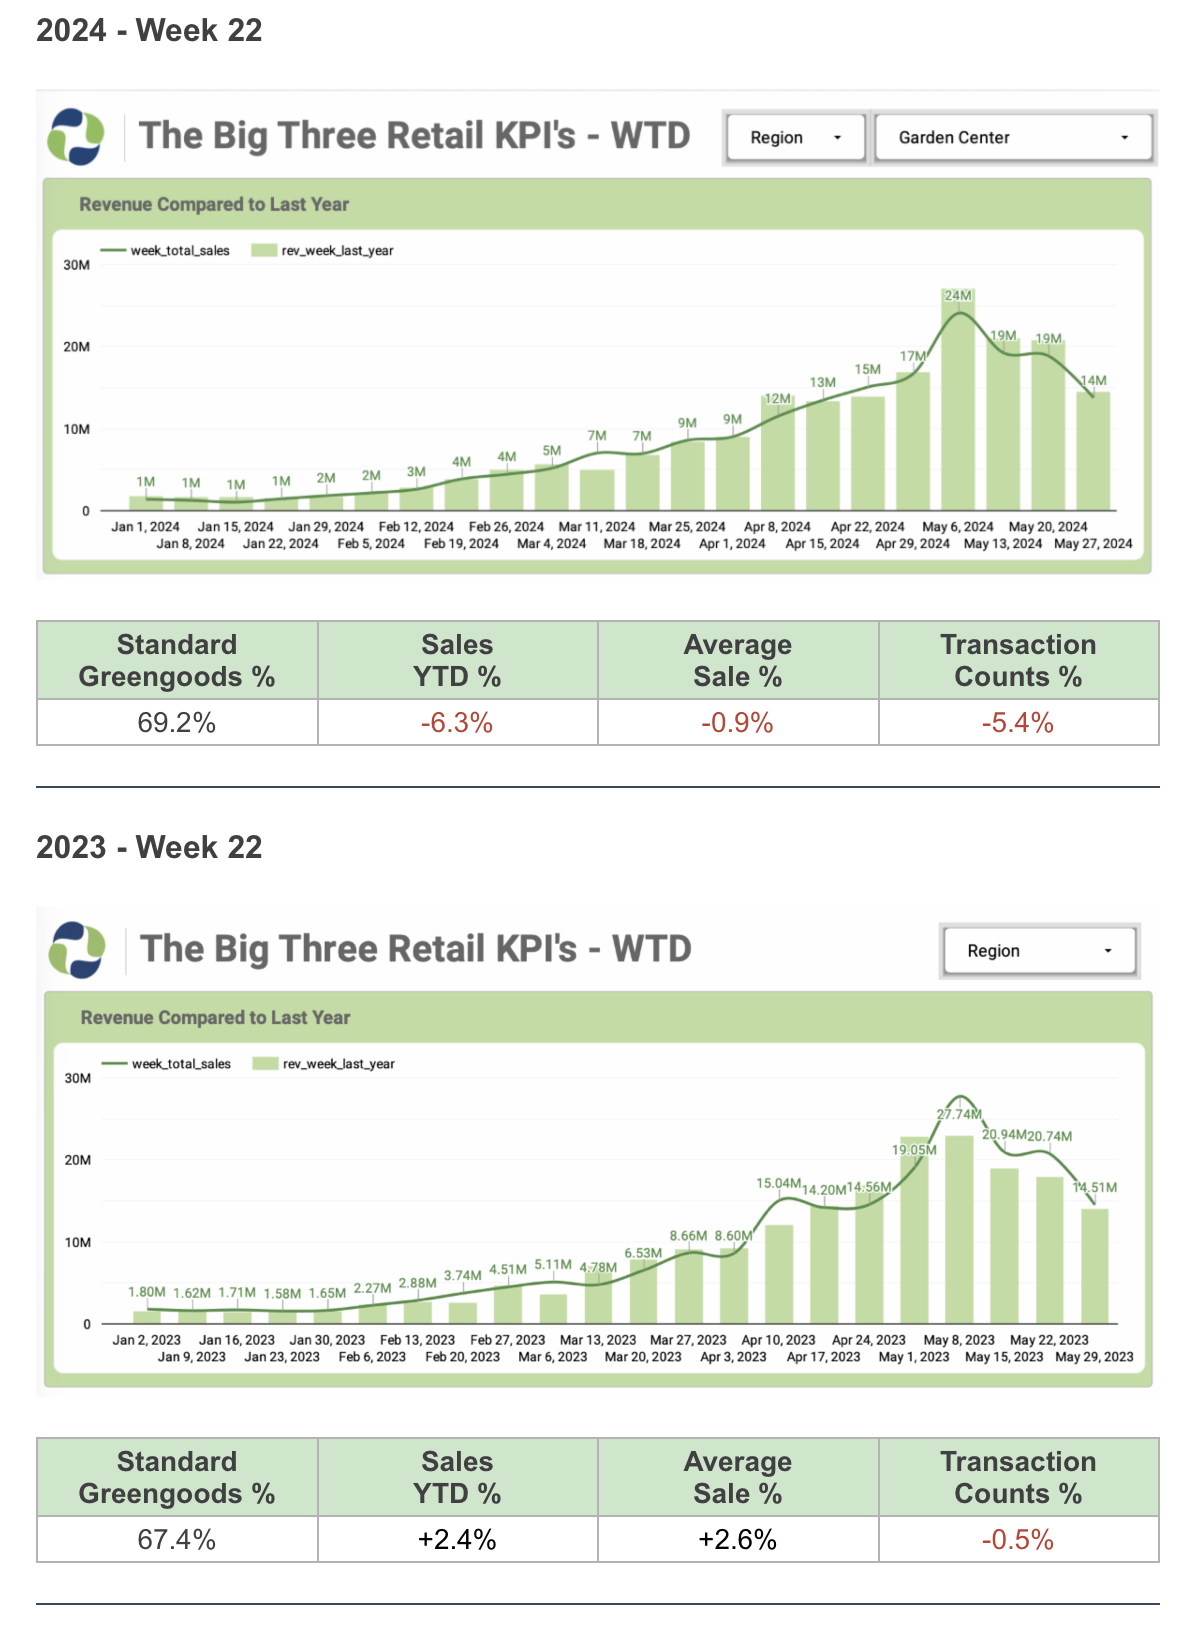
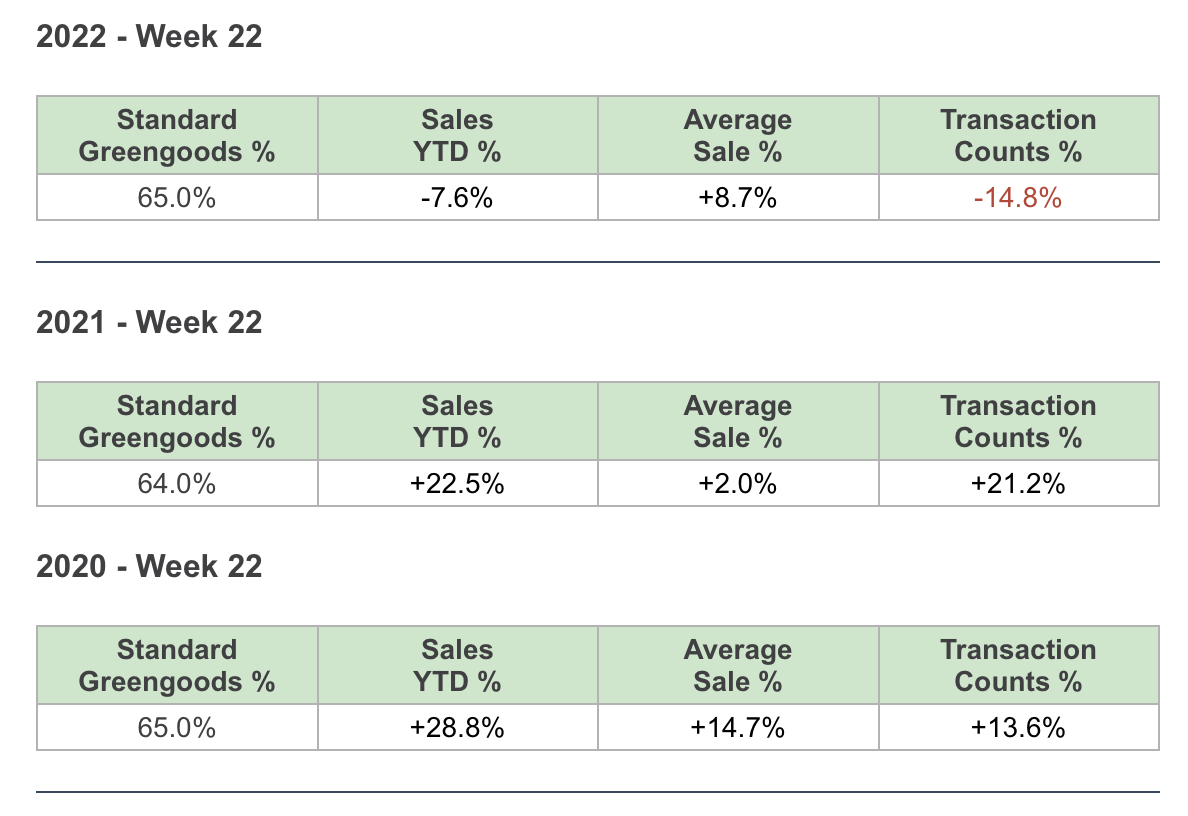
As I study these figures from the past six years of sales data for Week 22, I find a few Seasonal Trends especially interesting.
First, the year-over-year sales growth tells a remarkable story. It clearly shows the surge our industry experienced during 2020 and 2021, but it also demonstrates that we have not simply fallen back to pre-pandemic levels. Instead, we appear to be operating on a higher sales plateau established during those years, and we are now seeing growth on top of that foundation. That's an encouraging sign for our industry and for Group Centers.
The second trend—and the one I believe is most important from a profitability standpoint—is the percentage of total sales represented by the Standard Greengoods Group. A shift from approximately 65% to nearly 74% of sales from these categories can have a significant impact on the bottom line.
For many years, the Annual P&L Study has shown that our Best Practices Centers consistently report a higher percentage of sales coming from these Perishable categories. That is not a coincidence.
While these observations are based on results through Week 22, it's also helpful to remember how each of these years ultimately finished. The year-end results provide additional perspective and help us see whether these trends continued, strengthened, or changed as the season progressed.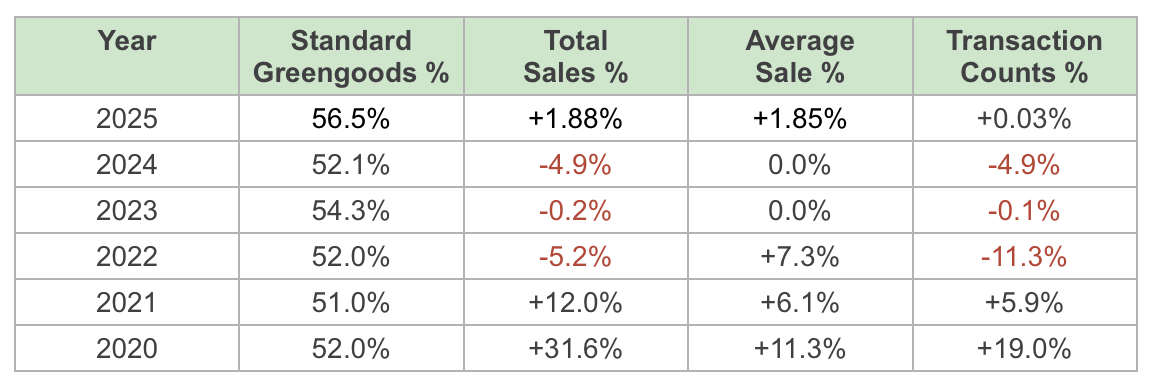
Often when I'm talking with someone about The Group's emphasis on selling more Perishables, I explain that we are not anti-hardgoods—or anti-Non-Perishables. Rather, we believe the hardgoods a Center chooses to offer should support the primary objective of selling plants.
Over time, the data has consistently shown that the higher the percentage of Greengoods sales a Center generates, the stronger the bottom line tends to be. That's why it's important to regularly evaluate the products you offer and ask a few simple questions:
- Does this product support plant sales?
- Does this product attract customers to our Center so we can sell more plants?
These questions can help sharpen your focus on what matters the most… your bottom line.
When the answer to those questions is “Yes," the product is likely helping your business. However, when the answer is “No"— especially when you consider the time, attention, space, and inventory investment that product requires—it may be worth reconsidering its place in your merchandising strategy.
At the end of the day, every square foot of retail space, every inventory dollar, and every hour of employee attention should be working toward your most important goal: growing profitable sales. The numbers continue to suggest that keeping plants at the center of that strategy remains one of the most reliable paths to success.
As I study each Weekly Department Review, I am reminded of the old saying, "Trying to fit four quarts into a two-quart jar." There is simply more information in the WDR than any of us can fully absorb in a single sitting.
Yet, by reviewing these figures week after week, you begin to develop a much deeper understanding of your business. You gain a better sense of your progress, recognize emerging trends, and learn to spot opportunities and challenges before they become obvious. Every season is unique, but comparing your results to previous years provides a valuable perspective and a more informed view of where you stand and where you may be headed.
This is also the perfect time for me to say THANK YOU to everyone who takes the time to report their numbers each week.
Your commitment to sharing your data creates one of the most valuable resources available to The Group. Every report strengthens the information, improves the comparisons, and helps all of us make better decisions.
And a special THANK YOU goes to Tim Quebedeaux for the countless hours he invests in transforming the numbers you submit into the Weekly Department Review and the many insightful comparisons we study throughout the year. Tim's work helps turn data into understanding and understanding into better business decisions.
Simply put, none of this would be possible without your participation.
You are an amazing group of retailers, and your willingness to contribute each week means more than you may realize. The information you share benefits not only your own Center but also every Center in The Garden Center Group.
Thank you for your commitment, your participation, and your willingness to help all of us learn, grow, and improve together.


Sharing is at the heart of The Group and your ideas are very important. If you have any trouble logging into The Group WebSystem, please let me know. Are you and your staff all subscribed to our eLists such as GroupEs, Retail-Grower, Retail-Landscape, Owners-Only, and a number of others? Need help subscribing? Let me know so I can show you how you can sign up.
Danny Summers
[email protected]
Tel: 678-909-7770
Cell: 678-761-7145
REMEMBER: Your interaction (by phone and email) with Group Service Providers such as Tim Quebedeaux, John Kennedy, Seawright & Associates, and of course Danny Summers are included in your retainer!
