
The 2023 Mid-Year in Review
by Danny Summers
Last week we received the special Mid-Year edition of the Weekly Department Review (WDR) from our resident Numbers Guru, Tim Quebedeaux (aka, The Cajun Cash Man).
I am always excited to see this edition as well as the Year-End edition. These are pieces of the puzzle that go into the Annual P&L Study. With our new WDR Online System that launched in January of this year, quite a bit has changed and each week we are able to see more of what I grew to expect from our two special editions. But there are still several areas I'm watching and waiting for and, of course, Tim always will surprise us with some new amazing details and views. This year is no exception. The following are a few of my observations from the special Mid-Year WDR as well as a few extra details Tim provided to me. (Thank you TQ!)
Let's begin by simply looking at participation this Spring of 2023 versus the Spring of 2022 (each comparing January 1 - June 30).
In the Spring of 2022, we averaged 88.3% reporting, 89.9 Centers reporting producing a total of 2,337 reports out of a possible 2,646 reports.
This Spring of 2023, we averaged 96.5% reporting, 103.4 Centers reporting producing a whopping total of 2,699 reports of a possible 2,796!
Let those numbers sink in... the 2,699 weekly reports built a tremendous amount of data that Tim can "slice and dice" for us each week and each Center can drill down in many different ways to compare themselves to peer Centers - 96.5% reporting!
WOW...The jump from 88.3% to 96.5% reporting is AMAZING and this is where we need to say THANK YOU to every Center that participates each week and, of course, all of the effort of Tim Quebedeaux for encouraging, prodding, and pushing reporting and managing all the numbers!
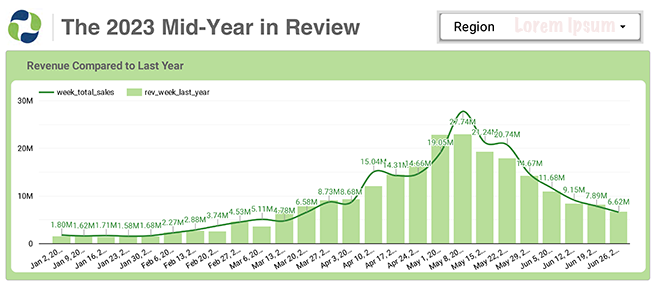
Here's a quick comparison of what we call "The Big Three" for the first six months. Keep in mind these are the YTD numbers we see each week in the WDR Online.
Sales YTD is +2.3% this year over the previous year, compared to -5.5% in Mid Year 2022. The 2022 sales were down against an +18.1% increase in Spring 2021. This year 61% Centers were up and 39% were down. This compares to 22% up and 77% down in Spring 2022.
Transaction Count YTD is +3.2% this year over the previous year, compared to -12.3% in Mid Year 2022. The 2022 Transaction Counts were down against a +13.9% increase in 2021.
Average Sale YTD is -0.9% this year over the previous year, compared to +8.3% in Mid Year 2022. Keep in mind in 2022 is where we saw the bulk of price increases (both at landed cost and selling). The 2022 Average Sale was up against a +7.8% increase in 2021.
The one area I am always excited to see in our Mid Year or Year End reports is the Balance of Sale by Category. Each week we see sales by category but only for that week. In the Mid Year, we get our first chance to see each category's performance for the entire Spring.
This Spring our Standard Greengoods categories gained in their percentage of total sales... reaching 62.5% this year, compared to 59% in 2022. Here's a breakout of each of the Standard Greengoods categories (first 6 below) plus Tropicals:
- Annuals - SLIPPED to 21.9%, compared to 22.0% in 2022 but still #1 Category.
- Container Gardens - SLIPPED to 0.8%, compared to 1.0% in 2022.
- Herbs/Veggies - SLIPPED to 4.3%, compared to 5.0% in 2022.
- Perennials - GAINED to 13.1%, compared to 11.0% in 2022 and still #3 Category.
- Shrubs - GAINED to 15.8%, compared to 14.0% in 2022 and still #2 Category.
- Trees - SLIPPED to 6.6%, compared to 7.0% in 2022.
And - Tropical Plants - SLIPPED to 6.7%, compared to 7.0% in 2022.
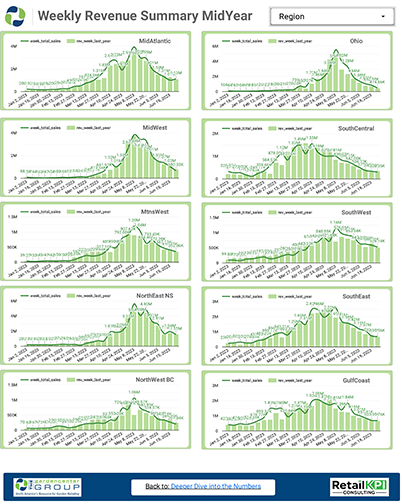 And one of Tim's surprise extras is a page that has Sales-By Week for each region. We normally see this for Total Group, but here Centers can look back at sales by region! It is easy to see each week, whether ahead or behind the same week last year. Here's a thumbnail teaser of what the real version looks like.
One final observation in this year's Mid Year WDR... OHIO, as a region, is reporting the largest overall increase at +9.4%. It is very fitting that we will be there in September for The Fall Event 2023!
Rounding out the top five are GULFCOAST, MIDWEST, MIDATLANTIC, and SOUTHEAST regions. Considering the big deficits the WETERN regions were up against with weather conditions, it is amazing NORTHWEST/BC is now positive at +0.2%, MOUNTAINS WEST is at -1.3% and SOUTHWEST is at -7.4% as many of these had -20% or more sales deficits to overcome by Mid Spring.
New this year is being able to look at the seasonality of the different regions… We all know they exist, we look for them in the numbers each year in past WDR reporting. BUT this year, we have the pictures to go with them! We will be working next on charting the Categories by Region… you will be able to see the seasonality of each category as the year progresses and by Region!
These are new and exciting ways to look at what we have been reporting for years. I know change is not always perfect, nice, or comfortable… but it is how we continue to get better.
With overall numbers being positive for Spring and Greengoods capturing a higher percentage of total sales, this year looks positive. The real question now is how effectively will Centers be able to manage the balance of the year, trimming expenses where needed and adding to revenues where possible.
A special THANK YOU to every Group Center who is reporting in the new WDR Online and, of course, Tim Quebedeaux for all his "wrangling" of the numbers each week for all of us. What all of you do is amazing and a valuable resource and just one part of what we call The Group Sharing Experience!


Sharing is at the heart of The Group and your ideas are very important. If you have any trouble logging into The Group WebSystem, please let me know. Are you and your staff all subscribed to our eLists such as GroupEs, Retail-Grower, Retail-Landscape, Owners-Only, and a number of others? Need help subscribing? Let me know so I can show you how you can sign up.
Danny Summers
[email protected]
Tel: 678-909-7770
Cell: 678-761-7145
REMEMBER: Your interaction (by phone and email) with Group Service Providers such as Tim Quebedeaux, Sid Raisch, John Kennedy, Jean Seawright, and of course Danny Summers are included in your retainer!