
History of the P&L Study - Part 1
by Tim Quebedeaux... and a little help from Steve Bailey!

The Annual Profit & Loss Study has been an industry exclusive since 2004 and is the most comprehensive P&L study of its kind. It started with 40 centers reporting in 2004 and has grown to a high of 78 centers in 2018 and 2021. The Study made a big step in 2006 when it started measuring Average Inventory, allowing us to measure Turns and Gross Margin Return On Inventory Investment (GMROII). After only 9 centers started reporting the new metrics in 2006, it quickly gained in popularity as it ramped up to 40 centers in 2009 and increased to 60 by 2021!

As we dig into the history of the P&L Study and look into lessons we can learn from trending out the Key Performance Indicators (KPI’s) over time, we need a solid set of data. Those Garden Centers reporting from 2009 to 2021 gave us the foundation we need to analyze the numbers. So, as you look at the graphs referred to in this article, be aware that the data comes from those reporting the data allowing the measurement of Turns and GMROII.
But, before we start to analyze those KPI’s let’s take a moment and listen to how the P&L Study began from the person who started it, Steve Bailey.
If you watched the video, with my minor in psychology, I loved the meaning of the red shirt. I am afraid I might be wearing more red shirts in the coming year… but I don’t have to! Let’s see how we can avoid the red by learning some lessons from trending out the KPI’s of the P&L Study.
The Simple Income Statement takes the accounts listing in the Profit & Loss Statement and simplifies it into 5 KPI’s, Revenues, Cost of Goods Sold, Operating Expenses, Wage & Wage Benefits (W&WB), and Profit. This is often very beneficial because P&L Statements usually range from 1-2 pages, but can get rather cumbersome. We have seen P&L Statements over 40 pages!!! There is a lot of data that is being tracked even in a couple of pages, but over 4-5 pages, much less 40 is often overkill. I love data, but more so, I love pertinent data.
We start with the first of the 5 KPI’s, Revenues.
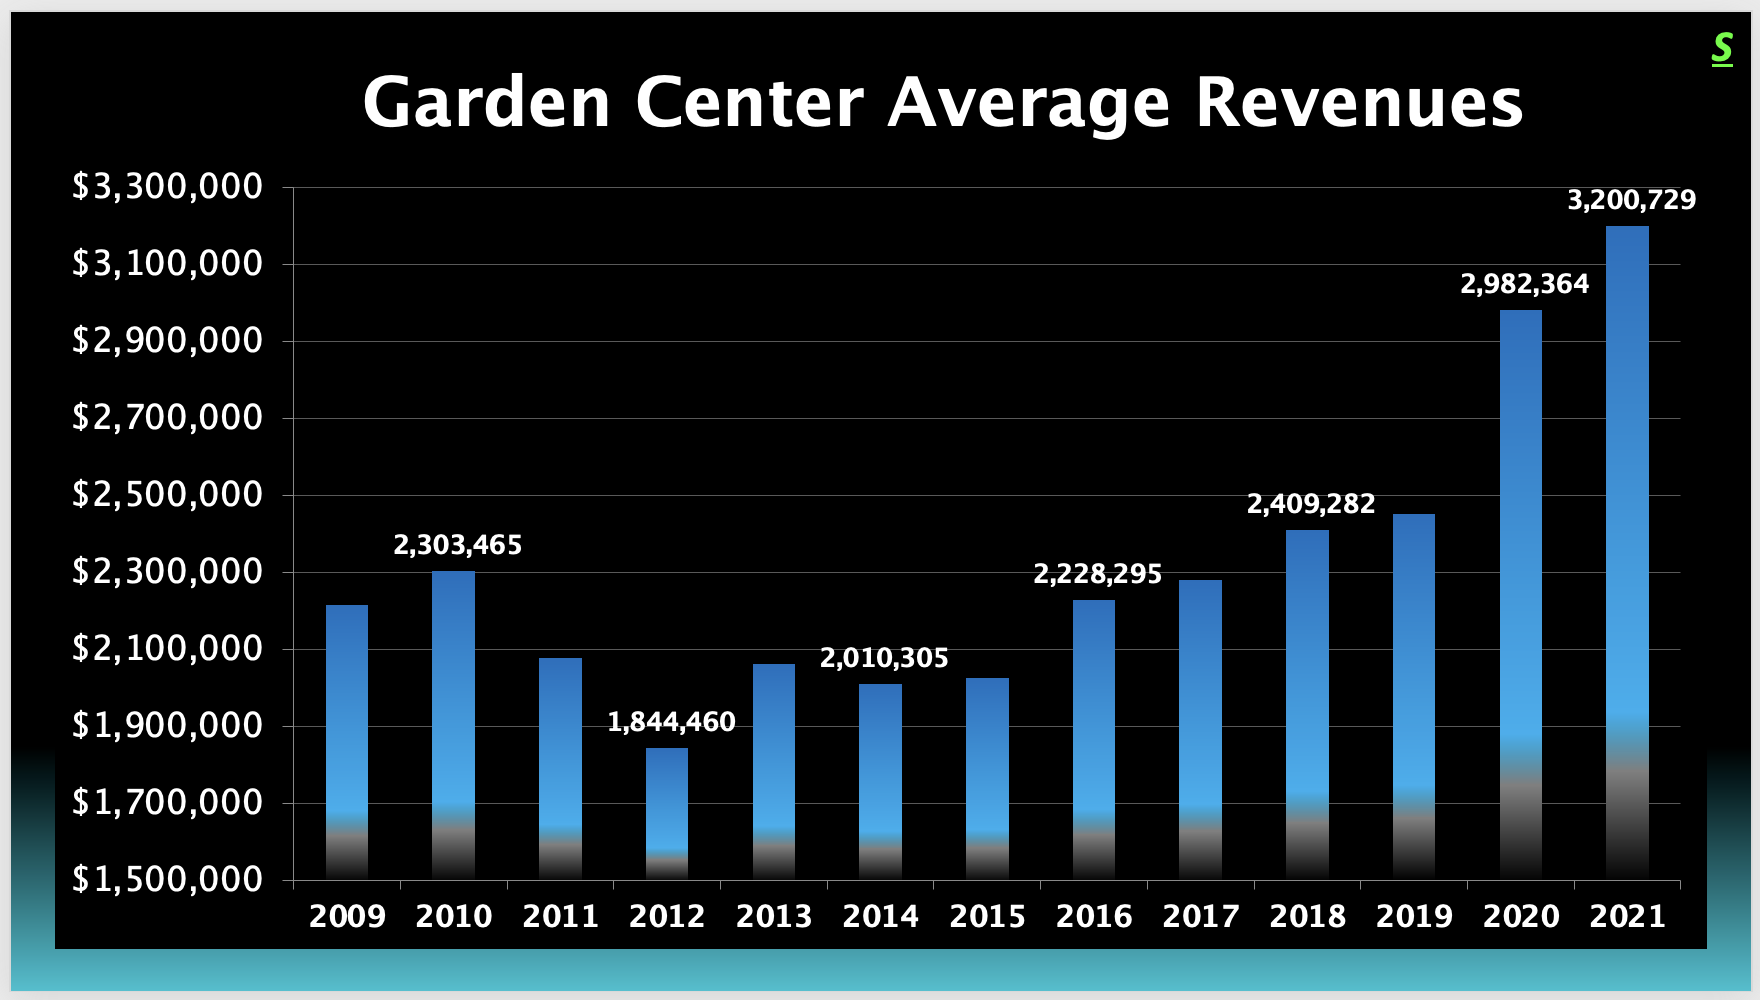
This graph is of the average yearly revenues of the target reporting centers. You can see the dip in Revenues from 2010 to 2012 caused by the Recession. The lowest levels were in 2012 and then jumped back up in the next year, to only slow down the next two years before a slow ramp-up through 2019. Then the Pandemic surge happened in 2020 and 2021. To make data comparisons, we take the percentage of dollars spent in the other numbers to the revenues level… All the data going forward will be in percentages. Thus, it is important to keep in mind this curve, because the next three KPI’s we look at can be pushed around percentage-wise by Revenue increases and decreases.
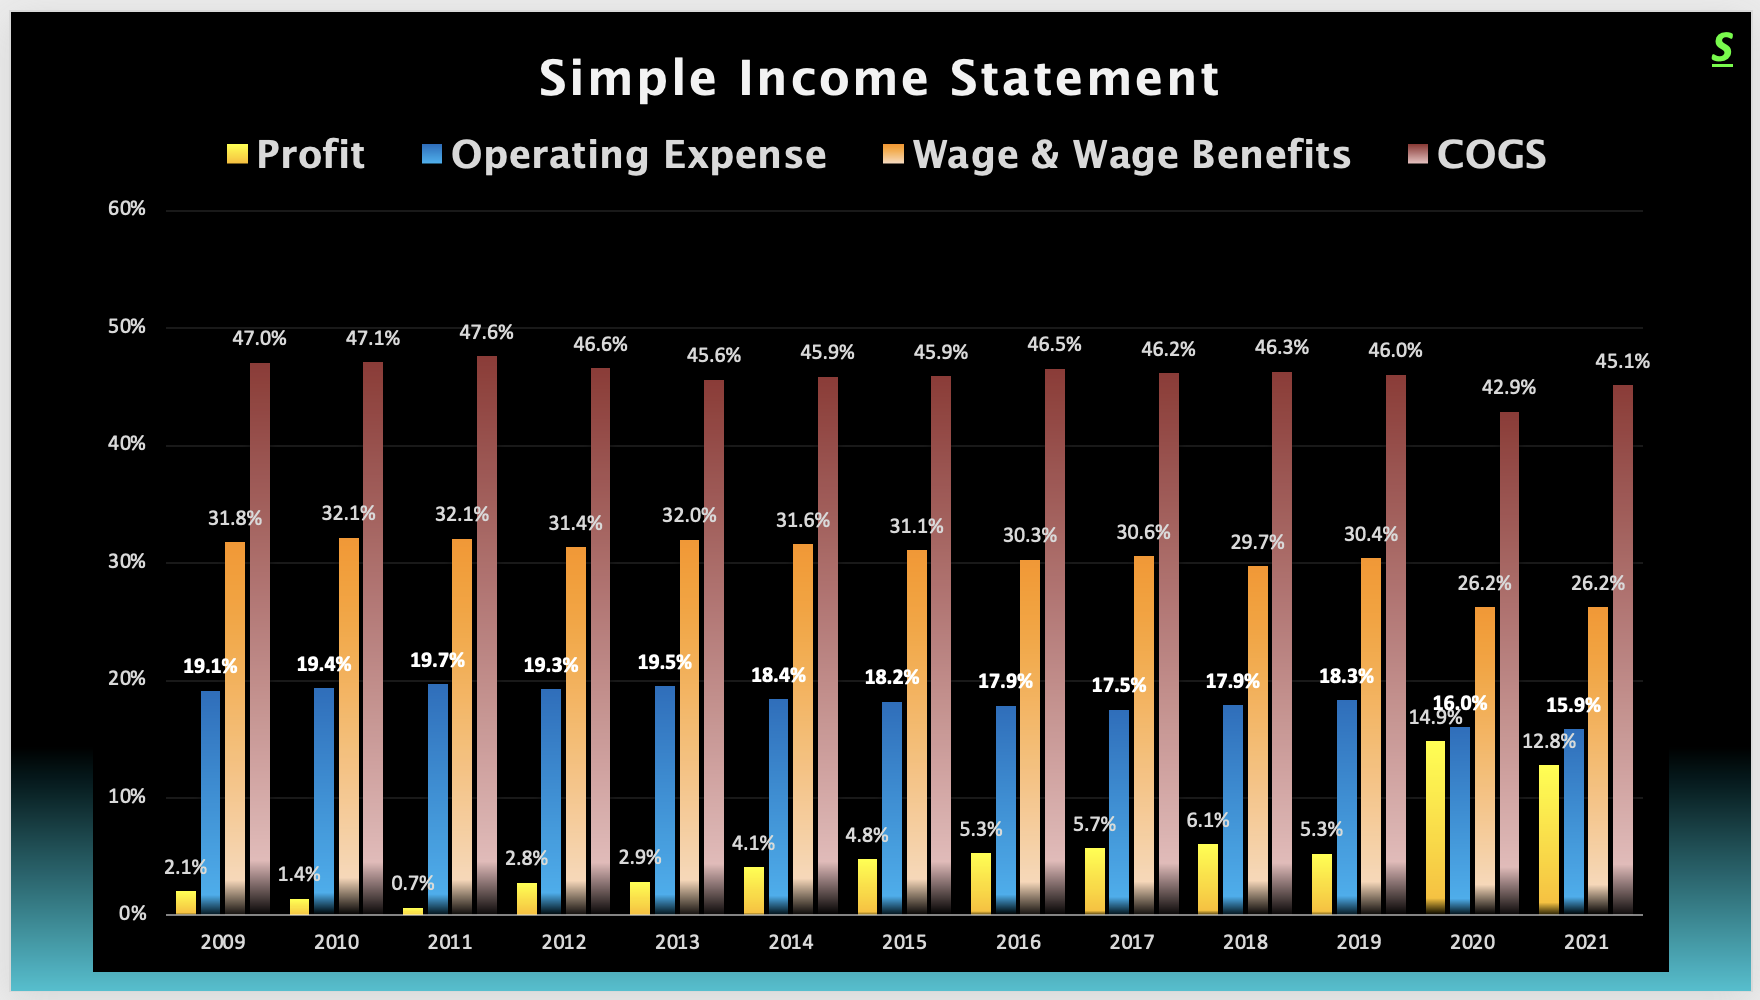
Looking at the trends of the remaining KPI’s measured in the P&L Study’s Simple Income Statement (SIS) can be anything but simple… But it does show us how they line up in regards to each other. When you then subtract the next three parts of the SIS: COGS, Operating Expenses, and Wage & Wage Benefits from Revenues what remains is Profit Dollars. Remember as the three expenses go down, profit goes up. When planning it is important to remember, do not chase revenues, chase profit. If you increase revenues by $10, a 10% profitable center will gain $1 on the bottom line. If you decrease any of the expenses by $10, you then increase the bottom line by… $10!
Profit Dollars are the Attained Margin dollars remaining after Operating Expenses and W&WBs are paid. Attained Margin dollars are your Revenues minus your COGS. Your profitability is your Profit Dollars divided by Revenues expressed as a percentage. Let’s look at the History of Profitability of our target reporting centers in the P&L Study.
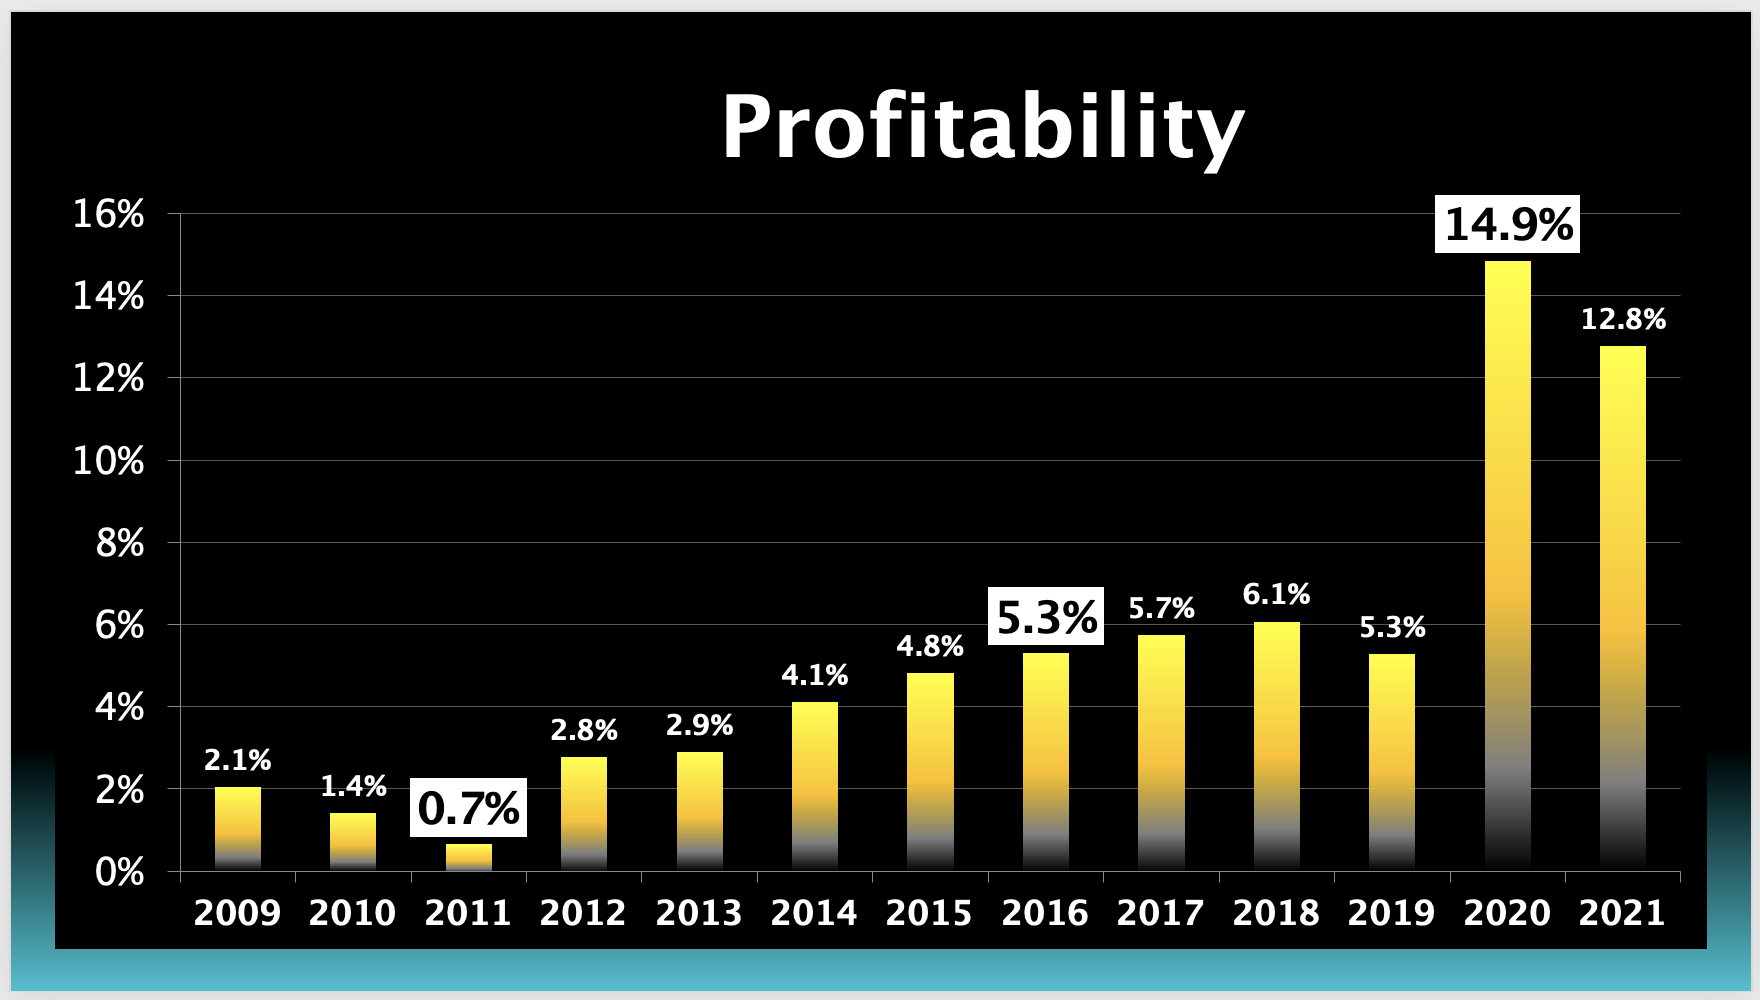
Within the P&L Study, there are two benchmarks in profitability, High Achievers and Best Practices. High Achievers are those who attain between 5% and 10% Profit. You can see the rebound out of the low during the Recession of 0.7% to attain that High Achiever level at 5.3% took 5 years. In comparison, to reach Best Practices level it only took one year (albeit a pandemic year or asterisk year). Going from 5.3% to 14.9% was an amazing boon. Let’s take a look at each of the three expenses of the SIS to see how each of those transitions happened.
So, in the next parts of this article, we will analyze the trends of Operating Expenses, Wage & Wage Benefits, and finally, Cost of Goods Sold.
Ready to move on to Part 2? SEE IT HERE!

Got questions or need more information about The Group's the Annual P&L Study or the Weekly Department Review (WDR)? Give Tim a call or email.
Tim Quebedeaux
Cell: 770.355.6249
Email: CLICK HERE
Tim Quebedeaux, RetailKPI Consulting, is a service provider for The Garden Center Group and manages all Group financial sharing programs. The Weekly Department Review (WDR) and The Annual P&L Study are industry exclusives developed by The Garden Center Group and are included in your retainer!
REMEMBER: Your interaction (by phone and email) with Group Service Providers such as Tim Quebedeaux, Sid Raisch, Jean Seawright, John Kennedy, and of course Danny Summers are included in your retainer! So what are you waiting for? Take advantage of all that The Group has to offer and give them a call or send an email now!