Revenues, Profit, and Bubbles
by Steve Bailey

As I recall, I was sitting on a plane in 2005 when I first saw it. If a light bulb has ever gone off for me, it was in that moment. My seatmate looked at me in a funny sort of way since he couldn’t understand my excitement while reading a USA Today.
I tore the page out of the paper and stuffed it in my pocket so I wouldn’t forget it. I couldn’t wait to get home and put some numbers to it to see if it would work. And it did. It takes so little to excite a numbers guy, especially if you are a Profit guy.
I was so excited I emailed it to Robert Hendrickson, who was traveling that week. He retrieved his emails and opened it and called me to ask, “What the heck am I looking at? Reminds me of something I saw back in the 60’s!”
The ‘it’ we were talking about is the P&L Study Profit Chart that garden centers receive back in their final report. Also known as the Bubble Chart, it is a direct representation of how well a center performed in Profit Dollars vs. garden centers of all sizes and modes of operation.
How does one chart do that? To answer that question, let’s look at the 2018 Profit Chart from the most recent P&L Study –
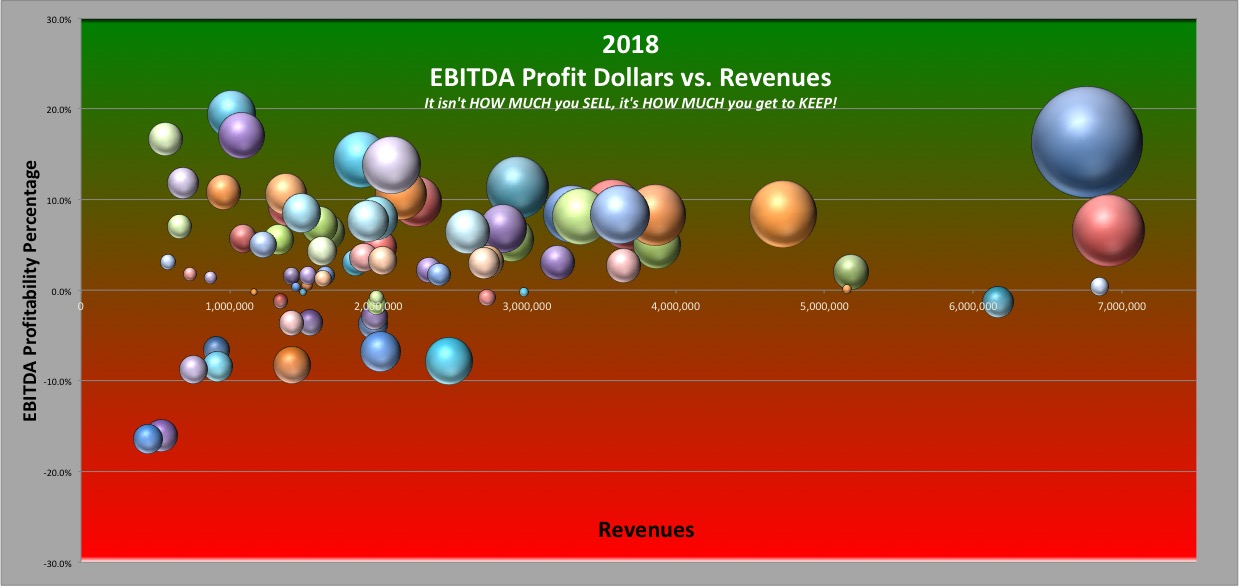
The chart is pretty simple. Each bubble is a garden center, seventy-eight in all last year. To begin, focus your attention on the horizontal line running through the middle of the chart. This is the Revenue line, indicating the level of Net Sales attained by centers represented by a bubble either above or below that line. Revenues begin at $0 at the left, progressing up to $7 million on the right.
Next, move up the left axis of the chart and notice the markings of 10%, 20%, and 30%. Do the same below the Revenue line indicating the same values, but in negative Profitability.
As I said earlier, each bubble is a garden center. The size of the bubble indicates the Profit Dollars attained by that garden center in relation to all of the other participating centers. The larger the bubble, the more Profit Dollars if you’re looking above the 0%/Revenue line. If the bubble is in the negative territory, a larger bubble indicates a larger loss.
The real lesson of this exercise lies in the fact that some centers have much larger Profit Dollars than centers doing two, three, or four times more in Revenues. Is that fair? In one word, no. But it’s easier to see in a chart or graph than it is to reiterate the chart’s tagline, “It isn’t HOW MUCH you SELL, it’s HOW MUCH you get to KEEP!” Thank you, Robert, for bringing that whole thought process to The Group over the years. The chart just reinforces it.
In the Excel version all centers receive, one can hover their cursor over a bubble and it will reveal all of the above – Revenues, Profit %, and Profit Dollars. Sorry, no names on this one, confidentiality is the code on the P&L Study. But I’m sure you will be able to pry a sliver of information out of the high-performing centers!
One other note – the shading in the Profit Chart. The red in the negative Profitability is intentional. A garden center cannot survive with long periods of negative or no Profit. The green in the Profitable area of the chart symbolizes prosperity and success.
If you participated in the 2018 Profit & Loss Study, you received a slightly different chart than the one above. Can you see the difference? It’s subtle, yet significant. Sid Raisch suggested that Profitability in the 0%-5% range is better than negative or no Profit, but it still should not be acceptable. It’s a Danger Zone, a level of performance that may not allow a garden center to buy good products to sell, keep good Staff, and pay the operating expenses while putting away money to pay for capital improvements. It is a non-sustaining way of doing business. For that reason, in this amended chart, the red of negative Profitability stretches on up into that low Profitability range.
It isn’t difficult to pick out the High Achiever centers at 5%-10% Profitability, (twenty-three total) and Best Practices over 10% (a whopping ten!). Those centers will be recognized at this year’s Fall Event in Nashville for their outstanding achievement in garden center management.
The ultimate goal of most centers is to have the largest bubble in the positive Profitability area, and for good reason. I often joke that centers like the Profit Chart as much as the numbers, judging by the number of calls and emails I get every year asking if the Bubble Chart is ready yet. And there’s nothing wrong with that. If you’re in contention for the largest bubble, it means you are managing your garden center for maximum Profitability. That’s a garden center that is going to be around for a long time, and one family or others will want to own.
So where’s your 2019 bubble going to land? Have you had a great year so far and you’re showing a high level of Profitability on your Profit & Loss Statement? If so, hold on. The last six months of the year can be the biggest drain on Profits unless managed. Typically, half or more can disappear if you’re not careful. You don’t want to see that happen, and neither do we. We want all the bubbles to be in the upper limits of the chart. And we want a lot of them.
Upward!
$teve

Got questions or need more information about The Group's Annual P&L Study, the Weekly Department Review (WDR) or your profitability? Give Steve a call or email.
Steve Bailey
Tel: 618.319.9205
Cell: 618.521.5225
Email: CLICK HERE
Steve Bailey is a service provider for The Garden Center Group and manages all Group financial sharing programs. The Weekly Department Review (WDR) and The Annual P&L Study are industry exclusives developed by The Garden Center Group and are included in your retainer!
REMEMBER: Your interaction (by phone and email) with Group Service Providers such as Steve Bailey, Robert Hendrickson, Sid Raisch, Jean Seawright, and John Kennedy are included in your retainer! So what are you waiting for? Take advantage of all that The Group has to offer and give them a call or send an email now!