2022 P&L Study Review & Awards - Part B
by Tim Quebedeaux
After recognizing the Winners of the Game – in P&L Study 2022 – Part A, we begin to look at what standards they set. Besides the big KPI’s reported in the first part of the study, we now look into the next few KPI’s measured in the study.
Your Physical Facility is an important part of your business and ultimately your profitability. Besides being a leading factor in which products you prominently present to your customers, it also gives you an allowance to charge what you need to so that you are profitable. Let’s dive into some Physical Facility Standards or benchmarks. We measure 3 major ratios: Revenues per Parking Space, Revenues per Acre, and Revenues per POS Terminal. By measuring these key ratios, we compare against the benchmarks as an alarm bell. If you are generating more than the standard in any of these metrics, you should be alarmed not into action but into investigation. For example, if you are generating more than one million per POS terminal, then you want to look at your busiest weekend to determine if you need to increase the number of terminals to handle peak business. From there take action as needed.
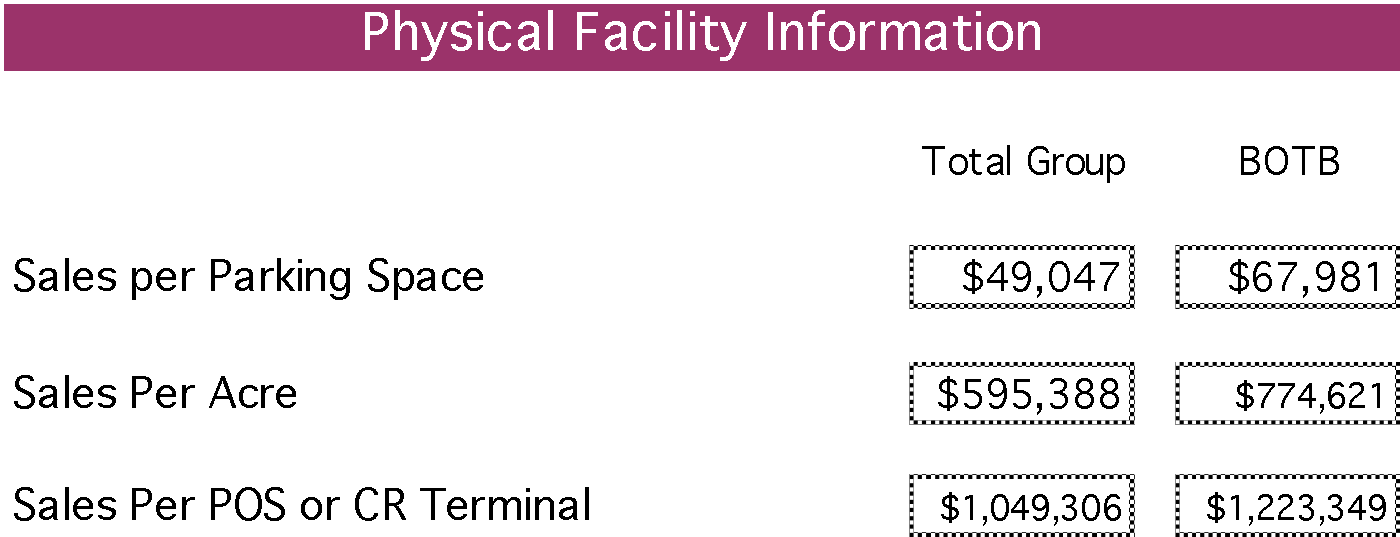
In 2022 the Best of the Best maxed out these ratios. Over performing in each, especially compared to total group. Even with decreasing revenues (-12.1%) over last year, they are still being very efficient with their facilities to convert those revenues into profit with minimal disruptions from their facilities. Having said that, how much more could they have done with more parking spots and/or more terminals during THE busiest times of the year? If you are maxing out your facility ratios, but are not making the profit… How can you improve your facilities to increase your profitability?
The next section, I see as the yearly wrap-up of the Big Three KPI’s we monitor weekly on the Weekly Department Review: Revenues, Average Sale, Transaction Counts. Instead of the weekly status, we see the Year End numbers. As a group, we showed a decrease in Revenues of 7.3%, with an increase in Average Sale of 1.8% and a decrease in transaction counts of 9.0%. We go a step further in these numbers and look at several that tie in the P&L KPI’s (Costs or Expenses). We look at Business Cost per transaction, which is the cost of business (Cost of Goods, Operating Expense, and Wage & Wage Benefits) per transaction. This is a great teacher to employees of how the business works. Compare Average Sale of the Group, $79.90, with Business Cost per transaction, $70.78. Showing that of the almost $80 sale, it cost over $70 to do business. Enlightening employees to the cost of making a profit in the Garden Center, not all of the money goes to owners’ pockets!

New in 2022 we measured the online Revenues. As we see this as an essential part of doing business going forward (at least that is the impression). We measured it as 0.7% of total revenues. For perspective, this is more than the following categories: Casual Furniture, Artificial Trees, Poinsettias, Pet, Sod, Water Gardening and Wild Bird.
Payment Types show the difference between Credit/Debit Cards, Checks, and Cash. This year we see 88% of Revenues in Credit/Debit cards, 4% in checks and 7% in cash. The biggest change from 2021, is the shift from use of cash to credit/debit cards, from 85% and 10% respectively. An interesting shift during these economic times.

The last metric to discuss in this part is GMROL, Gross Margin Return on Labor Hours. This is a great measure of productivity. Are the labor hours you are investing in producing enough margin dollars to sustain business? I use this metric along with W&WB percentage to evaluate productivity. In a time where labor is getting more and more expensive, I am told this is what we have to pay to get employees. Well, if that is what it is, and you must live with a higher W&WB percentage above goal, then two things… 1) Are you being productive, where is your GMROL? 2) Where else are you going to make up that expense… Operating Expenses lower or COGS lower?

In Part C, we will cover the report card for Inventory Control: Turns and GMROII, and the ultimate report card for your business… Your Balance Sheet!
Congratulations again to all the Centers that reported in the 2022 P&L Study and especially to our Award Winners!
What will the 2023 P&L Study be in comparison? You are creating those numbers right now. I can't wait to see them!

Got questions or need more information about The Group's the Annual P&L Study or the Weekly Department Review (WDR)? Give Tim a call or email.
Tim Quebedeaux
Cell: 770.355.6249
Email: CLICK HERE
Tim Quebedeaux, RetailKPI Consulting, is a service provider for The Garden Center Group and manages all Group financial sharing programs. The Weekly Department Review (WDR) and The Annual P&L Study are industry exclusives developed by The Garden Center Group and are included in your retainer!
REMEMBER: Your interaction (by phone and email) with Group Service Providers such as Tim Quebedeaux, Sid Raisch, Jean Seawright, John Kennedy, and of course Danny Summers are included in your retainer! So what are you waiting for? Take advantage of all that The Group has to offer and give them a call or send an email now!