History of the P&L Study - Part 2
by Tim Quebedeaux
Last time we left off, seeing that it took 5 years to go from 0.7% profitability to 5.3%, high achiever status, while in one year we went from 5.3% to an amazing 14.9%. Let’s dig into the three KPI’s in the Simple Income Statement to try to gain clarity on how we accomplished both feats.
The smallest piece of the pie is Operating Expenses. These expenses can be described as the other expenses section of the P&L Statement. Any expenses that are spent on things OTHER than people (W&WB) and product (COGS). This section is the lowest as a percentage of revenues, but the largest listing of accounts. Let’s look at the historical trend of our target centers in the P&L Study.
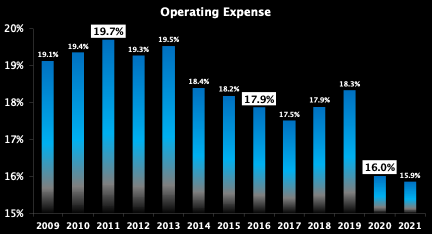
So, we can see during the Recession the Operating Expenses were up above 19%. It dropped down below the goal of 18% by 2016, when profitability went above 5%. The Operating Expense percentage often gets pushed around by Revenue increases and decreases. This is caused by the large number of fixed expenses which do NOT change as revenues change. So, part of the shifts is due to Revenues increasing, but some are also due to tighter controls. The large jump from 18.3% in 2019 to 16.0% in 2020 is due to that factor, as revenues increased 21.6% year to year. At the end of the day, Operating Expense Percentages tend to ebb and flow as Revenues ebb and flow.
Wage & Wage Benefits are those expenses attributed to personnel. This includes actual payroll as well as benefits. It also includes insurance, payroll processing, payroll taxes, training and uniforms.
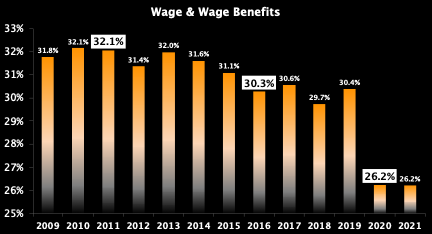
Through the recession, the W&WB percentages averaged 31.7%. When the target centers finally broke through to the High Achiever level, they decreased this expense and averaged 30.3% until the pandemic years. The drop-down to 26.2% in 2020 and 2021 is caused by both increasing revenues pushing down the percentage and by actually spending less dollars due to pandemic effects. Those effects include lack of employees, more hours worked by salaried employees, and less hours of operation whether due to closing or planned fewer open hours. Although the bottom line benefited, the people working over during the pandemic years faced burnout, so repeating this level of W&WB may not be ideal… time will tell.
The last expense is the largest percentage: COGS.
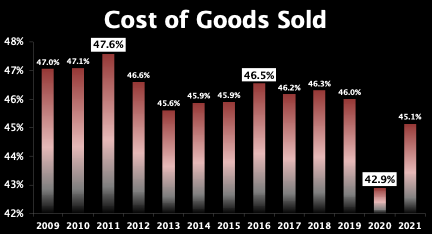
Trending the history of COGS shows us that not much has changed. The small changes seen can be explained. The highest expense year was our lowest profitable year… 2011. This high COGS, thus low Margin is due to the reduction of inventory as many centers were fully stocked when revenues died leaving them in a pickle! In selling off inventory at discounted prices, their margin took a hit. Quickly recovering the next two years, getting to the lowest COGS in 2013 at 45.6%. As profit moved from the low in 2011, to above High Achiever status, COGS didn’t move much as it peaked at 46.5% before slowly getting better over the next three years. Then came the pandemic year of 2020. No discounting was done as inventory was selling too fast! Unfortunately, we went backwards in 2021.
The goal of 44% was ONLY achieved in the exceptional year of 2020. We have the most opportunity going forward to maintain profitability year after year without regards to the increase or DECREASE of revenues in our COGS management… Can we avoid the wearing of the red? If we do, it will be our better inventory management resulting in decreased COGS year after year.
In Part 3 we will look into what the P&L Study Historical Trends show us with COGS, Turns, and GMROII.
Ready to see Part 3? SEE IT HERE!

Got questions or need more information about The Group's the Annual P&L Study or the Weekly Department Review (WDR)? Give Tim a call or email.
Tim Quebedeaux
Cell: 770.355.6249
Email: CLICK HERE
Tim Quebedeaux, RetailKPI Consulting, is a service provider for The Garden Center Group and manages all Group financial sharing programs. The Weekly Department Review (WDR) and The Annual P&L Study are industry exclusives developed by The Garden Center Group and are included in your retainer!
REMEMBER: Your interaction (by phone and email) with Group Service Providers such as Tim Quebedeaux, Sid Raisch, Jean Seawright, John Kennedy, and of course Danny Summers are included in your retainer! So what are you waiting for? Take advantage of all that The Group has to offer and give them a call or send an email now!