
The 2016 P&L Study – Let’s Talk Actual Numbers
by Steve Bailey

A few weeks back, we looked at the basic Profit & Loss Study, how it is constructed, and using your results to improve your Center’s performance.
Within the P&L Study, there are different subsets of Centers, most notably Retailers and Retailer/Growers. Also within the Study are subsets of Regional groups. Both are important as some results and ratios are more relevant to a mode of operation, others are tied more closely to a region of the country.
This week, let’s look at the five basic areas of the P&L Study, and the actual results of both modes of operation as well as Total Group and Best Practices/High Achiever performance.
Since the Revenue section is a reflection of Category percentage of total Revenues, which is another way of measuring revenue/product mix, let’s examine the Perishable (mostly plants) vs. non-perishable ratio. As you know, in many cases this mix of product your Center sells could pre-determine your Profitability.
It isn’t surprising that Retailer/Growers were 68.6% perishables vs. 64.4% for Retailers. That extra 4.2% of perishables/plants, normally a higher Margin/Profit area, should yield more bottom-line dollars. But will it? We’ll find out when we get to the bottom line – Profit.
Interestingly, Total Group (all 78 garden centers reporting) had nearly the same percentage – 65.4% vs. 65.7% - as the Best Practices/High Achiever (5% and above in Profitability). So what gives? Again, how does that pan out when the Total Group was 4.9% Profitable and BP/HA was 10.8%? There had to be other factors contributing to overall Profitability.
Those ‘other’ factors could begin in the Cost of Goods Sold section, but they don’t. Best Practices/High Achievers COGS expenses were 45.5% vs. 49.9% for Total Group, hardly that 5.9% spread we see in Profitability. So there must be other factors that contributed to higher Profitability. By the way, as expected, Retailers were at 48.3% vs. Retailer/Growers’ 43.4%. Again, 4.9% less expense should equal that much more Profitability for R/Gs. Should is the key word here. Read on.
The Operating Expense section was no surprise when comparing the Retailers and Retailer/Growers. R/Gs have more expenses growing a crop, thus higher expense percentage - 18.9% vs. 17.5% for Retailers. A little piece of that lower COGS/higher Margin was eaten up as a result, but hopefully not the entire extra Margin. Total Group came in at 17.9%, Best Practices/High Achiever 16.1%. Better performance in this section added 1.8% more Profitability to the BP/HA bottom line.
Onward to the last expense section in the P&L Study, Wage & Wage Benefits. Like Operating Expenses, we would expect R/Gs to have a higher percentage since it takes more people/wages to grow a crop. And it did, 33.4% vs. 29.2%. That’s a whopping 4.2% in expenses and less Profitability. I can smell Profit melting away from what should be an advantageous position of growing your own plants.
The Total Group percentage of 30.3% in W&WB was 2.7% higher than the Best Practices/High Achiever group at 27.6%.
Take all the numbers above and assemble them into an easy-to-read table, and it looks like this –
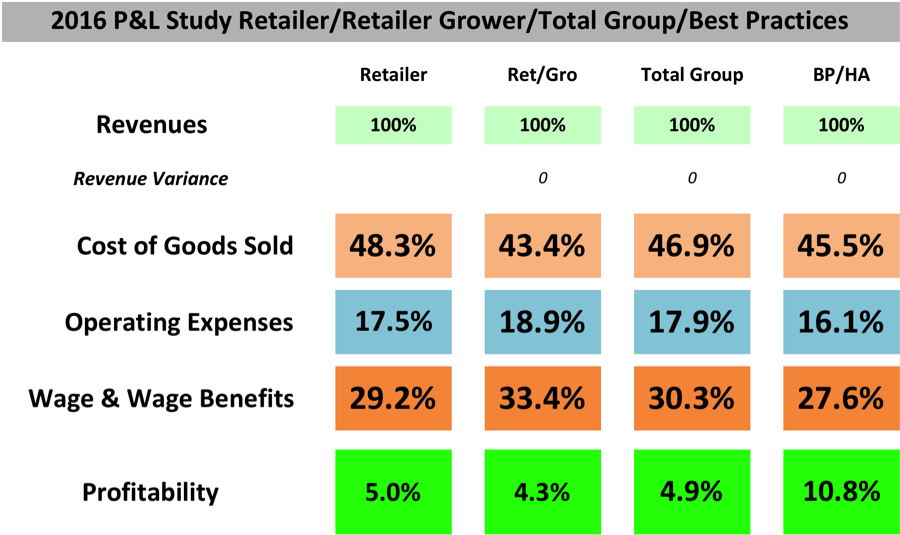
Combine all the ups and downs in expenses discussed above, and the Profitability shown is the result. Keep in mind that on $2,000,000 in Revenues, each percentage of Profitability difference is a $20,000 difference on the bottom line. 5% difference in Profitability is a $100,000 difference. It adds up quickly.
The Regional group percentages contain more subtle differences, usually relating to product availability, higher or lower fuel oil costs, and differences in Wage & Wage Benefits. I use these on a case-by-case basis, but the subsets we examined here are the most relevant to most Centers.
All of the ratios and measurements we’ve discussed today are in relation to overall sales groups. Keep in mind that there are three sales levels analyzed in each Retailer and Retailer/Grower subset. Mining that data, as we did briefly above, could yield even more relevant data pertinent to your Center.
Conclusions
We’ve identified the reason the Best Practices/High Achiever group was 5.9% higher in Profit than Total Group, and it wasn’t lower Cost of Goods Sold. It was in Operating Expenses and Wage & Wage Benefits. The BP/HA group as a whole declined in inventory management 2016 vs. 2015. Great overall performance, but think what their Profitability would have been if they would have achieved the same or a little better in that area!
The same holds true for Retailer/Growers. They have a huge opportunity to attain a higher level of Profitability, yet as a group, they expend a lot more effort for less on the bottom line than a Retailer buying in their entire product. I’m not proposing that all Retailer/Growers should stop growing, but they should identify the areas of their center that need improvement and make the changes that increase overall performance.
Come to think of it, that last sentence is the purpose of The Group’s P&L Study. Use it to your advantage. Give us a call if you need assistance.
Steve

Email: CLICK HERE
Steve Bailey is a service provider for The Garden Center Group and manages all Group financial sharing programs. The Weekly Department Review (WDR) and The Annual P&L Study are exclusives to The Garden Center Group and are included in your retainer!
REMEMBER: Your interaction (by phone and email) with Group Service Providers such as Steve Bailey, Robert Hendrickson, Sid Raisch and Jean Seawright, are included in your retainer! So what are you waiting for? Take advantage of all that The Group has to offer and give them a call or send an email now!