There’s Gold In Them ‘Thar Hills
The Group's Special Mid-Year 2018 Weekly Department Review
by Steve Bailey

Go ahead, admit it, the title including ‘gold’ sucked you right in, didn’t it? Maybe the thought of a gold expedition at The Fall Event (gold is indeed mined a couple of hours west of Salt Lake City) or some other promise of riches pulled you into reading this article.
Well, nothing as exciting as a gold expedition, but there is reward to be found in The Group’s Special Mid-Year 2018 Weekly Department Review. If your Center was one of the seventy-eight that did report, follow along with me in the report as you read this, and you’ll see a portion of my thought process as I review it weekly. If your Center did not report, know the information in this article is just a tip of the iceberg for what you could receive each and every week if you report.
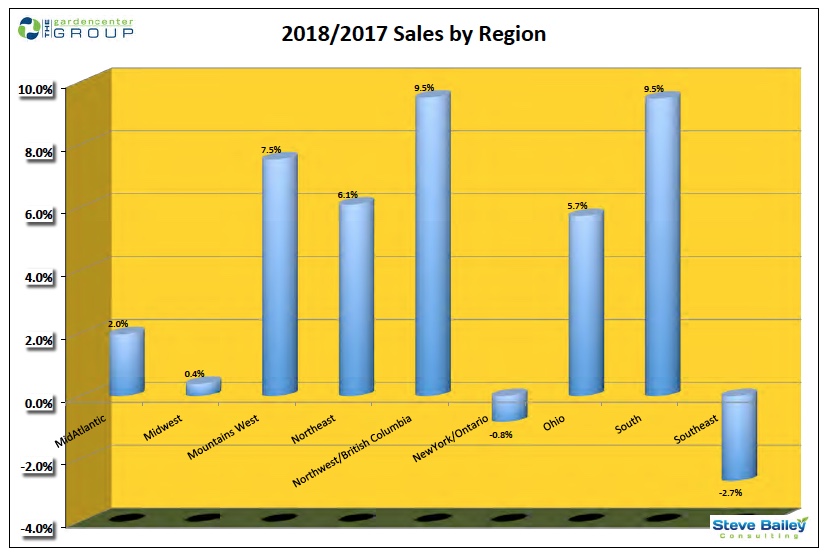
Let’s begin with good news - Revenues vs. Last Year. 66% of the reporting Centers were up over last year, 34% down. Using the Regional Group report (averages of averages) as a guide, overall the increase totaled +4.1%, with the South up the top at 9.5%! That’s where I would begin my hunt for any Center in that Region that is up more than their region and emailing them to find out how they did it. No matter how you look at it, an increase in Revenues is a good sign as we head into the home stretch of the last six months. Keeping that momentum going will be a challenge, but one that should pay at year-end.
As to total Revenues, Annuals (at 26% for Total Group) dominated in all regions except the South. This is definitely good news as Annuals are the best combination of Margins and Inventory Turns, which means the highest Gross Margin Return on Inventory Investment. That’s not to play down the South’s higher percentage of Shrubs if they can make it perform as well in that Category as others do in Annuals. We’ll find the answer to that question in the 2018 Profit & Loss Study at year-end. Yes, a shameless plug for your Center to report to that one as well.
Following Annuals, the highest Category percentages were Shrubs (14%), Perennials (11%), and Landscape Non-Plant at 9%.
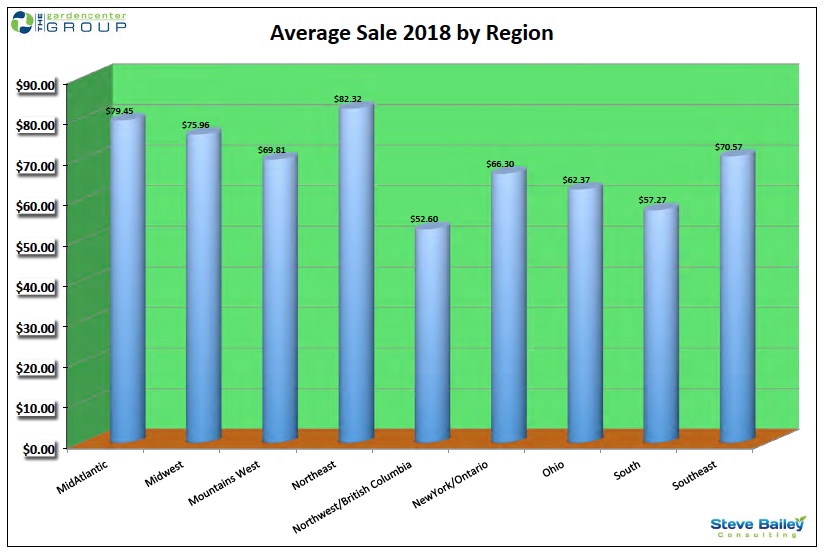
Average Sale during the first six months was $68.52, which is considerably higher than we find for an entire year. Although we would think the higher number of Annuals sold would bring this down, consideration has to be given to the type of product sold during the spring time frame, which usually includes higher ticket items, too.
Even better news is that the Average Sale is up +4.1%. Average Sale within The Group has been increasing over the past few years and the trend is continuing in 2018.
The Average Sale increase is even better news when you consider the Transaction Count is basically flat at +0.1% increase. An increase in Average Sale has been covering many Center’s flat or drop in Transaction Count. In most cases, this cannot continue. If Average Sale decreases for whatever reason and Transaction Count continues to decline, the net effect is decreased Revenues. As many of you experienced from 2008-2012, this has a very bad effect on Profitability due to Fixed Expenses.
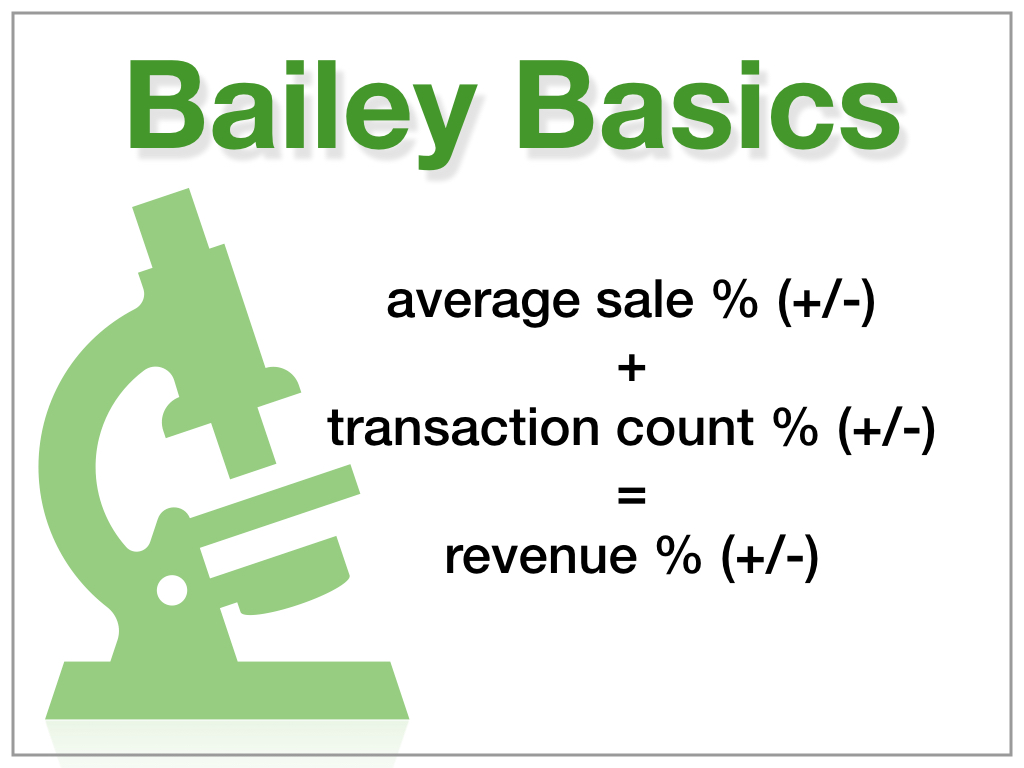
One side note. If you add the percentages of Average Sale increase or decrease to the Transaction Count percentage increase or decrease, the result will be Revenue increase or decrease. It worked even in this average of averages. This is a tool you can use for planning purposes at the beginning of the year. Give me a call if you would like more information.
At the end of June, the overall Labor to Sales ratio was at 20.0%. If only we could hold it at that point until December 31st, Group centers would be about 10% higher in Profitability. But, alas, the last six months Payroll is harder to control as Staff that are not needed after the Spring season are retained. Help is available within The Group on how to hire Staff with the expectation of Spring employment only, allowing flexibility when it’s time to cut the cord. Combine this with Payroll Budgeting and the result is a year-end Wage & Wage Benefit percentage that is conducive to maximum Profitability.
There’s so much more in the Special Mid-Year report on a Sales level and Regional basis. Look deeper for ‘the gold’ which are answers to your questions. Note the centers that are doing what you want to do, and ask them how they did it. If you don’t get answers there (or even if you do), ask The Group service providers. Although I’m always ready to answer any question you might have on the financial issues or ratios you don’t understand, you should be aware that many of the WDR ratios may relate back to operational factors that may be solved in facility improvement, staff training, marketing, or other services you can access through The Group. All of us are ready to hear from you and willing to help you with any challenges you face.
Give us a call.
$teve