Jul
05
Drilling Down for Higher Performance
by Danny Summers
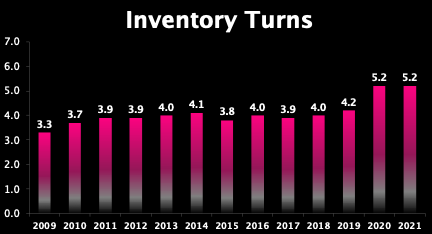
We are excited to announce a whole new level of Awards that we will present at The Fall Event 2024. They have been developed through collaboration within The Group Team, particularly Tim Quebedeaux and Sid Raisch. In the last 3 years, the level of benchmarking through The Group's Annual P&L Study has become more detailed. For years, Group Centers were comparing themselves to Total Group Averages and then against the Best Practices Group Averages.
But, as the terms apply, these are Averages and within each of these groups, there are Centers that are higher and lower to produce the Average. But what about the best-performing Centers? Who is performing best?