Group Blog Articles
Filtered by category: Tim Q's Blog Clear Filter

Building Balanced Inventory

Building Balanced Inventory

by Tim Quebedeaux

[The following is a message Tim Quebedeaux created and originally shared through Garden Center Magazine as part of their State of the Industry Report.]

Profit dies as non-perishable inventory ages...
but there are ways to keep it from lingering on the shelves.

Read More

2022 P&L Study Review & Awards - Part C

2022 P&L Study Review & Awards - Part C

by Tim Quebedeaux


Part C – “Best Practices Standards” – Inventory Turns, GMROII, and Balance Sheet

The last parts of the Study: Turns, GMROII & Balance Sheet, are only available to the participants who report through parts 4 and 5 of the P&L Study. They can compare how they performed as compared to their different sectors – Region, Mode of Operation, Sales Levels, and then Total Group and Best of the Best. They get to compare these metrics down to the category level! The level of detail here is where they have the information to win the game!

Read More

2022 P&L Study Review & Awards - Part B

2022 P&L Study Review & Awards - Part B

by Tim Quebedeaux

After recognizing the Winners of the Game – in P&L Study 2022 – Part A, we begin to look at what standards they set. Besides the big KPI’s reported in the first part of the study, we now look into the next few KPI’s measured in the study.

Your Physical Facility is an important part of your business and ultimately your profitability. Besides being a leading factor in which products you prominently present to your customers, it also gives you an allowance to charge what you need to so that you are profitable. Let’s dive into some Physical Facility Standards or benchmarks. We measure 3 major ratios: Revenues per Parking Space, Revenues per Acre, and Revenues per POS Terminal. By measuring these key ratios, we compare against the benchmarks as an alarm bell. If you are generating more than the standard in any of these metrics, you should be alarmed not into action but into investigation. For example, if you are generating more than one million per POS terminal, then you want to look at your busiest weekend to determine if you need to increase the number of terminals to handle peak business. From there take action as needed.

Read More

2022 P&L Study Review & Awards - Part A

2022 P&L Study Review & Awards - Part A

by Tim Quebedeaux

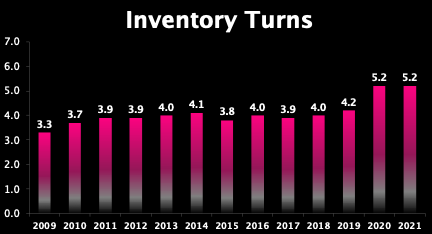
Congrats to all the Garden Group Centers that reported in the 2022 P&L Study! To be able to even think about changing your business for the better, you need to be able to measure what you are going to change. Being able to report to The Garden Center Group Annual P&L Study is a great start! Once you have that accountability in the numbers, the all-important Key Performance Indicators (KPIs), you can begin to hold your business accountable for its profitability!

The P&L Study measures many different KPI0s. It starts with the big one, Revenue by category or department. Then it measures the next three as a percentage of those revenues, Cost of Goods Sold (and the reciprocal, Margin), Operating Expenses, Wage & Wage Benefits. Leaving us with the most important measurement that we all depend on, Profitability.

Read More

History of the P&L Study - Part 4

History of the P&L Study - Part 4

by Tim Quebedeaux

Last time we finished talking about Average Inventory and how it is key to inventory management which is graded by two KPI’s: Turns and GMROIIs.  Historically The Group has not done well with these two metrics.


Read More

History of the P&L Study - Part 3

History of the P&L Study - Part 3

by Tim Quebedeaux

Last time we left off with the premise that we can avoid the wearing of the red if we manage our inventory better. Inventory management can be “graded” by two important KPI’s: Turns and GMROII (Gross Margin Return on Inventory Management). Those two KPI’s are driven by three metrics, COGS, Margin Dollars, and Average Inventory. Average Inventory is a key component when analyzing these KPI’s.

Let’s start with reviewing what happened with Cost of Goods Sold and how that is related to Margin.

Read More

History of the P&L Study - Part 2

History of the P&L Study - Part 2

by Tim Quebedeaux

Last time we left off, seeing that it took 5 years to go from 0.7% profitability to 5.3%, high achiever status, while in one year we went from 5.3% to an amazing 14.9%.  Let’s dig into the three KPI’s in the Simple Income Statement to try to gain clarity on how we accomplished both feats.

The smallest piece of the pie is Operating Expenses.  These expenses can be described as the other expenses section of the P&L Statement.  Any expenses that are spent on things OTHER than people (W&WB) and product (COGS).  This section is the lowest as a percentage of revenues, but the largest listing of accounts.  Let’s look at the historical trend of our target centers in the P&L Study.


Read More

History of the P&L Study - Part 1

History of the P&L Study - Part 1

by Tim Quebedeaux... and a little help from Steve Bailey!

The Annual Profit & Loss Study has been an industry exclusive since 2004 and is the most comprehensive P&L study of its kind.  It started with 40 centers reporting in 2004 and has grown to a high of 78 centers in 2018 and 2021.  The Study made a big step in 2006 when it started measuring Average Inventory, allowing us to measure Turns and Gross Margin Return On Inventory Investment (GMROII).  After only 9 centers started reporting the new metrics in 2006, it quickly gained in popularity as it ramped up to 40 centers in 2009 and increased to 60 by 2021!


Read More

A Consistent Piece of the Pie

A Consistent Piece of the Pie

by Tim Quebedeaux

Every week on average over 100 garden centers send in their Weekly Department Review (WDR) form. Those reports are compiled and a summary is produced and sent back out to those who reported. That summary gives the Group a quick snapshot of where sales are going for the year.

We not only get what happened by category for that week, but we also get where the group is annually through Year-to-Date revenues, transaction counts, and average sale values compared to last year at the same point. Along with other metrics such as labor to sales and Inventory at retail to sales, we get a good sense of where we are compared to last year any given week.

Read More

Annual P&L Study 2021 - Being the Best!

Annual P&L Study 2021 – Being the Best!

by Tim Quebedeaux

From Raising the Bar to Pushing the Boundaries!  In the 2019 P&L Study the top line comparison was changed from the High Achiever and Best Practices group, to only the Best Practices Group.  Well, that changed in 2020, in creating the Best of the Best Group, which in 2021’s P&L Study, took the place of the Best Practices group as the lop line in the Study to compare against.

Like in marksmanship, we want everyone to aim small, miss small. This small group of Best of the Best (BOTB) had 9 of the 10 Garden Centers repeat in 2021.  We wanted to show a standard above what had been presented in the past. Not only did this give everyone a higher standard to aim for, it gives the Best Practices Group (largest number ever at 48) a chance to raise their own standards.

Read More

Annual P&L Study 2021 - Part 4

Annual P&L Study 2021 - Part 4

by Tim Quebedeaux

To unlock the door to profitability, two Key Performance Indicators are needed to hit their goals, Inventory Turns and GMROII.  The largest Best Practices group in the P&L Study history (with 44 Garden Centers in 2020) was surpassed in 2021 with 47! Below is a list of 37 of these Centers with the remaining 10 (Best of the Best) to follow.

2021 P&L Study Best Practices Group


Read More

Annual P&L Study 2021 - Part 3

Annual P&L Study - Part 3

by Tim Quebedeaux

Today we will reveal who is in the High Achievers Group defined as attaining between 5% & 10% Adjusted Profit in 2021. Eighteen Garden Centers were able to navigate through all the challenges of last year to achieve an average of 8% profitability. 

The High Achievers of the 2021 P&L Study:

Read More

Annual P&L Study 2021 - Part 2

Annual P&L Study 2021 - Part 2

by Tim Quebedeaux

For the second year in a row, the Best of the Best group is needed for comparisons for this year’s P&L Study.  The difference this year is that they replaced Best Practices in the far-right column as the top numbers for comparison.  Remember, they are the top ten in profitability among those who filled out all 5 parts of the P&L Study.  This year they increased profitability from 18-25% to 19-31%.  Nine of the ten Garden Centers in 2020 repeated this level of profitability in 2021… Perennially Profitable Garden Centers!

In 2021 we had 78 Garden Centers report to the study, and 47 filled in all 5 parts.  If you didn’t fill in all parts, please reach out to us, we can help you improve your accountability to be able to report to all 5 parts of this remarkable Study.

Read More

Annual P&L Study 2021 - It's Beyond WOW!

Annual P&L Study 2021 - It's Beyond WOW!

by Tim Quebedeaux

P&L Study 2021, after the WOW year of 2020, we were prepared… and the results showed it.  But how did the pandemic and the eventual supply chain issues eventually affect our readiness for 2022? The numbers show the story.

Let’s start with the number of High Achievers (5-10% Adjusted Profit) and Best Practices (10% plus Adjusted Profit).  Both of those percentages are adjusted if you are a Retail Grower based on the amount of grown product sold.  With a record-tying 78 participating garden centers, the total number of High Achievers and Best Practices also set a new record, with a total of 65, outreaching 61 in 2020.  And even more Best Practices – 47 in 2021, three more than 2020.

Read More

WDR 2022 - Weekly Department Review

WDR 2022 - Weekly Department Review

by Tim Quebedeaux

This weekly snapshot into what is happening during any given year has proved itself very worthy in the last two years.  During the start of the Pandemic in the spring of 2020, it gave hope and direction to those centers whose seasons occurred later.  They could see the South and Southeast Regions sales and customer traffic not only happening, but increasing over the last year.  The WDR does this every year, but during that spring it was reassurance to those centers who could see what was coming and make decisions based on that.

A repeat performance in 2021? Almost.  We didn’t know what the revenue levels would be, but with the pandemic still having a grip, centers were once again able to see what was coming.  Being better prepared for it than they were in 2020, they were able to take advantage of the opportunity.

Read More

Annual P&L Study 2020 - Best of the Best Awards

Annual P&L Study 2020: Best of the Best Awards

by Tim Quebedeaux

Raising the bar… In the 2019 P&L study the top line comparison was changed from the High Achievers and Best Practices Group to only the Best Practices Group.  We wanted to show a standard above what had been presented in the past.  Not only did this give everyone a higher standard to aim for, it gave those who were profitable, but wanted more, a chance to raise their own standards.

Well, 2020 blew that out of the water!  We had more than half of the reporting centers achieve Best Practices and a whopping 82% report above High Achievers status. Once again, the need to keep raising the bar arose thus, The Best of the Best Group was born.  In looking into this group, we will find out what it takes to capitalize on the opportunity in 2020.  What did the KPI’s tell us about how they realized the highest level of profitability (18% to 25%)?  As we crunch those numbers, we will compile a new report that allows those who reported to compare their performance to this group.  This will be available during The Fall Event 2021 in Wilmington, DE.

Read More

Annual P&L Study 2020 - Best Practices

Annual P&L Study 2020 - Best Practices

by Tim Quebedeaux

Inventory turns, GMROII and the Best Practices Group all go together like rice and Gumbo!  You hit your goals for those first two, you are almost always in the last one.  The largest Best Practices group in the P&L Study history with 44 Garden Centers increased their Inventory Turns and GMROII, but was it what we thought it would be? We will visit this topic during The Fall Event 2021 in Wilmington!


Read More

Annual P&L Study 2020 - High Achievers

Annual P&L Study 2020 - High Achievers

by Tim Quebedeaux

Today we will reveal who is in the High Achievers Group defined as attaining between 5% & 10% Adjusted Profit in 2020. A slightly smaller group this year, going from 18 to 16. They were able to navigate through all the challenges of last year to achieve an average of 8.3% profitability.


Read More

Annual P&L Study 2020 - Best of the Best

Annual P&L Study 2020 - Best of the Best

by Tim Quebedeaux

The Best of the Best group from this year’s P&L Study really stood out.  Who are they… you will find out, but first what defines Best of the Best?  They are the top ten in profitability from those who filled out all 5 parts of the P&L Study.  They performed to the tune of 18-25% Profitability… WOW!

Read More

Annual P&L Study 2020 - It was a WOW Year!

Annual P&L Study 2020 - It was a WOW Year!

by Tim Quebedeaux

For the P&L Study 2020, one word is being used to describe it… WOW! Even with our expectations of a great year, we were still amazed at what was reported.

Let’s start with how revenues increased year over year. The previous year revenues increased 2019 over 2018 at 2.2% compared to 25.1% increase for 2019 over 2020. Amazing! This graphic below illustrates how the 5 year trend of a typical Center with $1 million in sales has grown over the period and the dramatic affects of the 2020 year results.

Read More