2023 P&L Study Review - Part B
by Tim Quebedeaux

Part B – “Best Practices Standards” – Physical Facility, Revenues, Payment Types, and Labor Hours
Last week we saw how the Bubble Chart shows us how important the bottom line (Profit) is, over the top line (Revenues). It states, “It is not how much you SELL, it is how much you KEEP."
After identifying those Garden Centers that kept more than others in 2023, we begin to look at what standards they set. Besides the big KPI’s reported in the first part of the study, we now investigate the next few KPI’s measured in the study.
Physical Facility
Revenues, Payment Types, and Labor Hours
Your Physical Facility is an important part of how your business is defined. The way you are set up leads to what you sell. And remember, you are what you sell… and those Garden Centers that are more profitable, tend to offer/sell more perishable products. So, I ask… Are you set up to allow for more perishable sales vs non-perishables? Outside of your Revenues by category percentages, the following benchmarks will reveal the efficiency of your facility.
We measure three major ratios, Revenues per Parking Space, Revenues per Acre, and Revenues per POS Terminal. By measuring these key ratios, we compare against the benchmarks as an alarm bell. If you are generating more than the standard in any of these metrics, you should be alarmed not into action but into investigation. For example, if you are generating more than one million per POS terminal, then you want to look at your busiest weekend to determine if you need to increase the number of terminals to handle peak business. From there respond as needed.
Again in 2023 the Best of the Best maxed out these ratios, overperforming in each, especially compared to total group. Even with revenues decreasing two years in a row, they are still very efficient with their facilities to convert those revenues into profit with minimal disruptions from their facilities. Having said that, how much more could they have done with more parking spots or more terminals during THE busiest times of the year? If you are maxing out your facility ratios, but are not making the profit… How can you improve your facilities to increase your profitability?
The next section, I see as the yearly wrap-up of the Big Three KPIs we monitor weekly on the Weekly Department Review: Revenues, Average Sale, Transaction Counts. With the annual P&L Sudy, we see the Year End numbers instead of the weekly data.
As a group, we saw Revenues decrease by 3.5%, with an increase in Average Sale of 1.7% and a decrease in transaction counts of 5.3%. We go a step further in these numbers and look at several that tie in the P&L KPIs (Costs or Expenses). We look at Business Cost per Transaction, which is the cost of business (Cost of Goods, Operating Expense, and Wage & Wage Benefits) per transaction. This is a great teacher to employees of how the business works. Compare Average Sale of the Group, $83.79, with Business Cost per transaction, $76.01, showing that of the almost $84 sale, it costs over $75 to do business. Enlightening employees to the cost of making a profit in the Garden Center, not all the money goes to owners’ pockets!
Continuing to monitor the newly measured online Revenues (started in 2022), we see this as a potential essential part of doing business going forward. We measured it as 0.8% of total revenues this year, up from 0.7%. For perspective, this is less than half of the categories we measure.
Payment Types show the difference between Credit/Debit Cards, Checks, and Cash. This year we see an 89% of Revenues in Credit/Debit cards, 5% in checks, and 6% in cash. This is not a notable difference from 2022, but a change from 2021. The shift from use of cash to credit/debit cards, from 85% and 10% respectively is an interesting shift during these economic times.
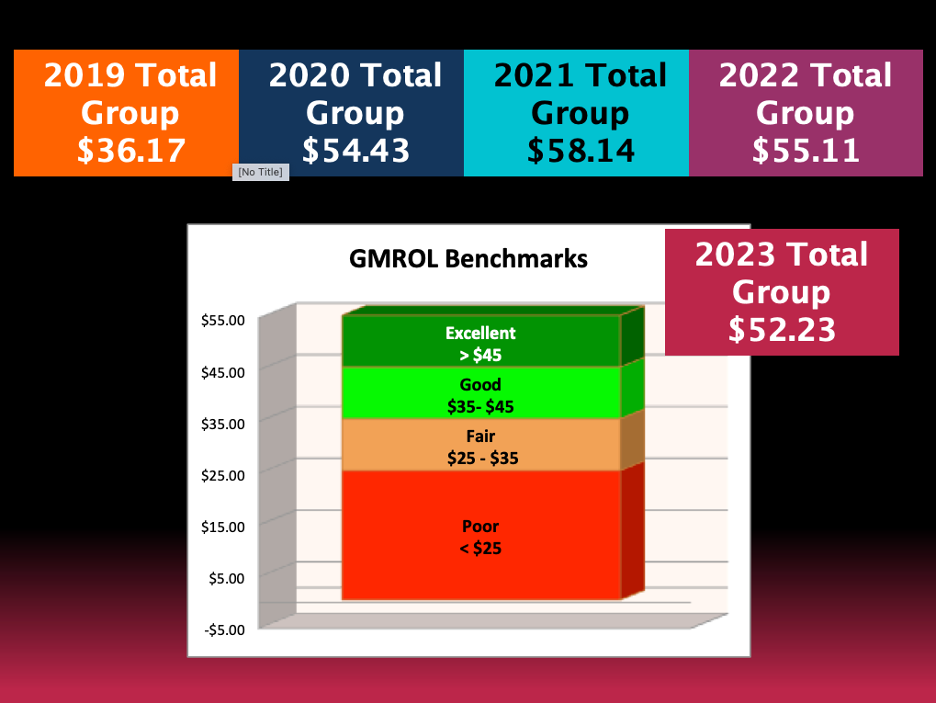
The last metric to discuss from this part is GMROL, Gross Margin Return on Labor Hours. This is a great measure of productivity. Are the labor hours you are investing in producing enough margin dollars to sustain business? I use this metric along with W&WB percentage to evaluate productivity.

You can see the Best of the Best is very efficient with their labor hours matching their better-than-goal W&WB percentage. If you had a low GMROII and a high W&WB percentage, then you have an issue…. You need to generate more margin dollars with the same hours spent (being more efficient) or spend fewer hours to generate the same amount of margin dollars (also being more efficient). Either way, things need to change…. Where do you stand on this important KPI?
Next week, we will cover the report card for Inventory Control: Turns and GMROII, and the ultimate report card for your business… Your Balance Sheet!


Got questions or need more information about The Group's the Annual P&L Study or the Weekly Department Review (WDR)? Give Tim a call or email.
Tim Quebedeaux
Cell: 770.355.6249
Email: CLICK HERE
Tim Quebedeaux, RetailKPI Consulting, is a service provider for The Garden Center Group and manages all Group financial sharing programs. The Weekly Department Review (WDR) and The Annual P&L Study are industry exclusives developed by The Garden Center Group and are included in your retainer!
REMEMBER: Your interaction (by phone and email) with Group Service Providers such as Tim Quebedeaux, Sid Raisch, Jean Seawright, John Kennedy, and of course Danny Summers are included in your retainer! So what are you waiting for? Take advantage of all that The Group has to offer and give them a call or send an email now!