Oct
14
History of the P&L Study - Part 2
by Tim Quebedeaux
Last time we left off, seeing that it took 5 years to go from 0.7% profitability to 5.3%, high achiever status, while in one year we went from 5.3% to an amazing 14.9%. Let’s dig into the three KPI’s in the Simple Income Statement to try to gain clarity on how we accomplished both feats.
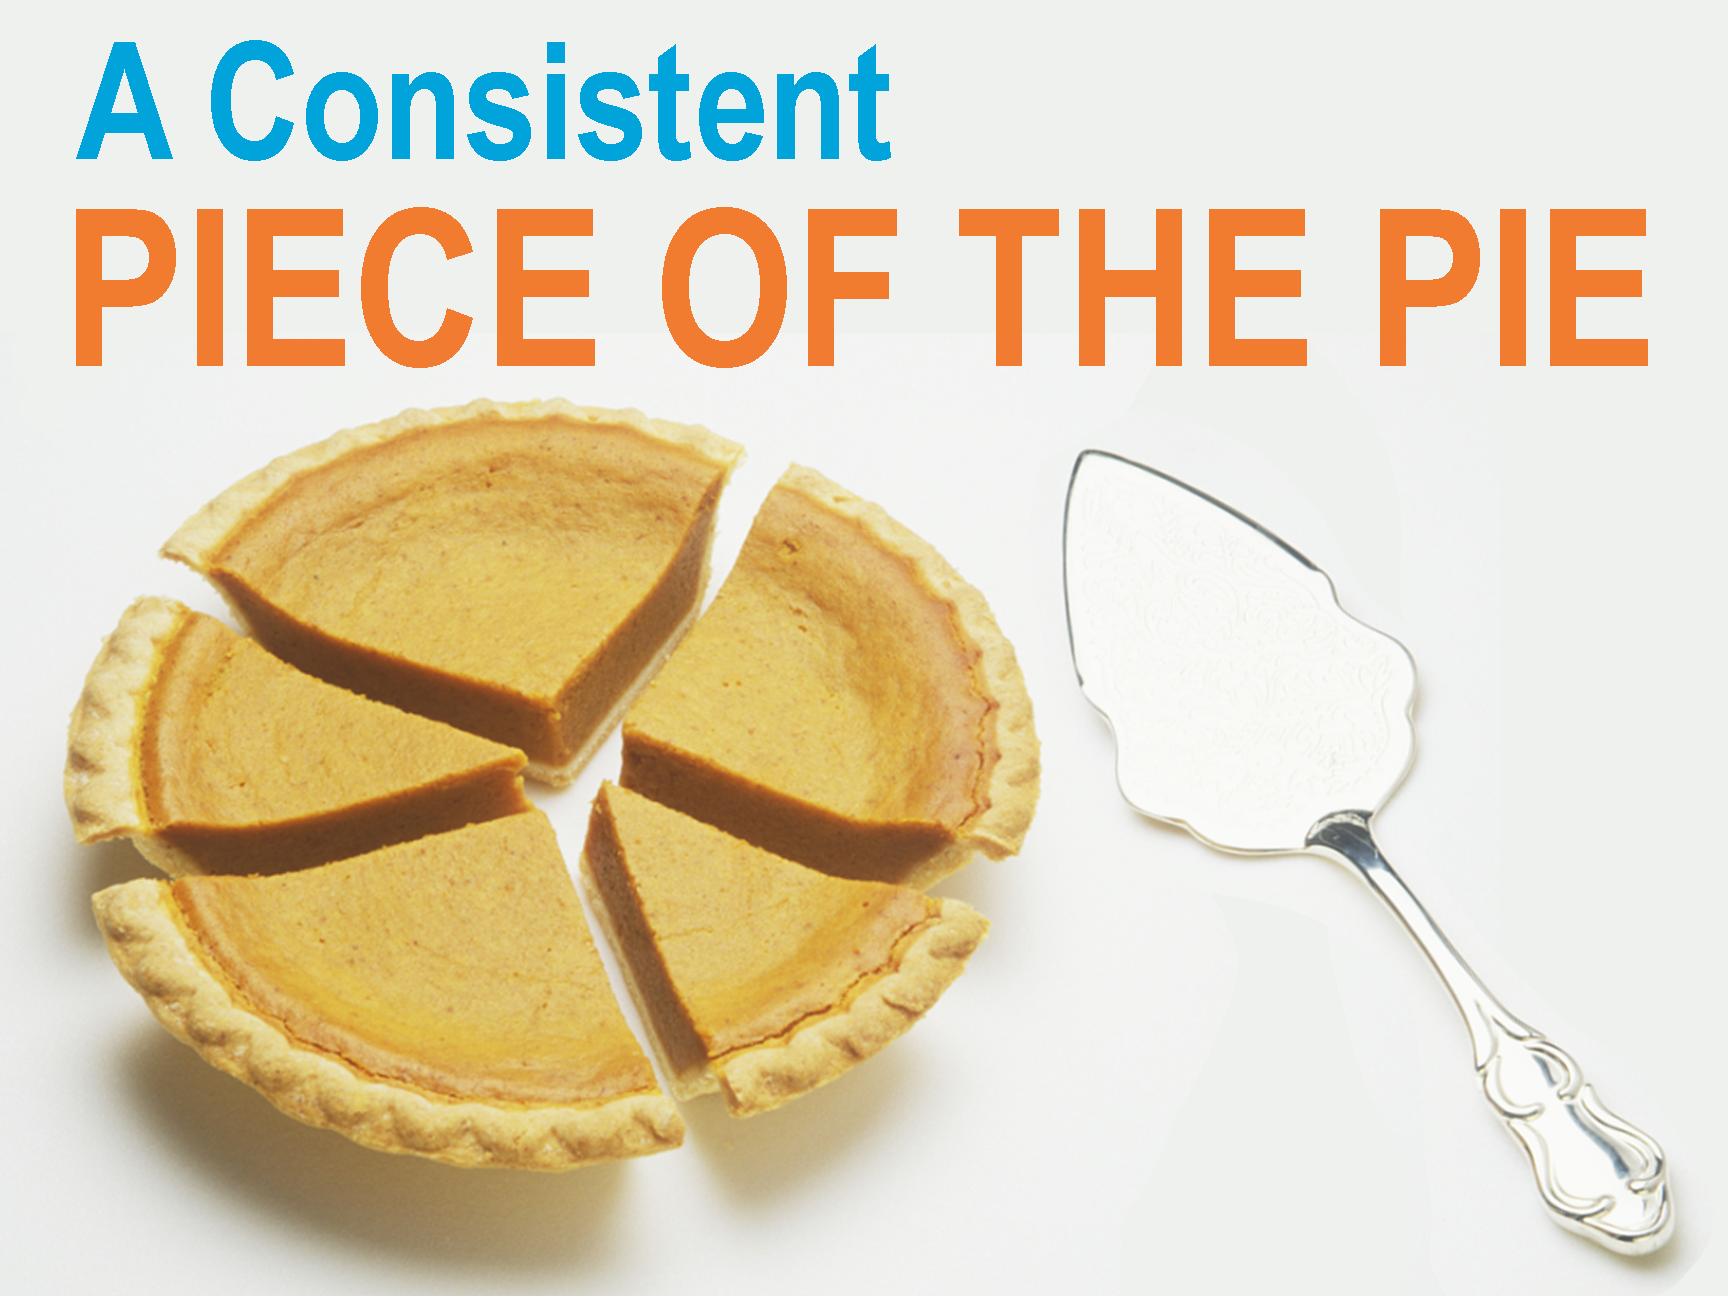
The smallest piece of the pie is Operating Expenses. These expenses can be described as the other expenses section of the P&L Statement. Any expenses that are spent on things OTHER than people (W&WB) and product (COGS). This section is the lowest as a percentage of revenues, but the largest listing of accounts. Let’s look at the historical trend of our target centers in the P&L Study.